Scan path analysis by Metrovision
- Home
- Visual function tests
- Eye movements
- Scan path analysis
(This feature is not available for sale in the United States of America)
Introduction
Many tasks of daily leaving involve visual information.
Reading, walking, driving a vehicle,.. bring into play factors
that are sensory, motor and cognitive.
A quantitative approach is desirable for the assessment of aptitudes,
monitoring rehabilitation, analysis of the effectiveness of new treatments, etc.
Today, a number of solutions are available for this purpose such as quality
of life questionnaires, analyzes of speed and errors in reading tests.
Scan path analysis can provide additional information to these global approaches:
- The quantification of the number of fixations and of the amplitudes of saccades,
in relation to the perceptual span,
- The completeness of the exploration. Are some areas ignored?
Does the subject compensate the alterations of his visual field?
- The systematization of exploration...
Metrovision's eye tracker
The measurement of eye movements is obtained from video images recorded using a near infrared camera.
A reflective dot is used to determine the position of the head. The direction of gaze is measured from
the position of the pupils with respect to this dot. This technique is quite insensitive to artefacts
such as parasitic reflections.
Application to reading with IReST texts
IReST texts are today one of the main international standards for reading tests.
They were developed by the IReST study group and are available in 17 different languages.
Each language version includes 10 texts of the same length, equalized in difficulty and linguistic complexity.
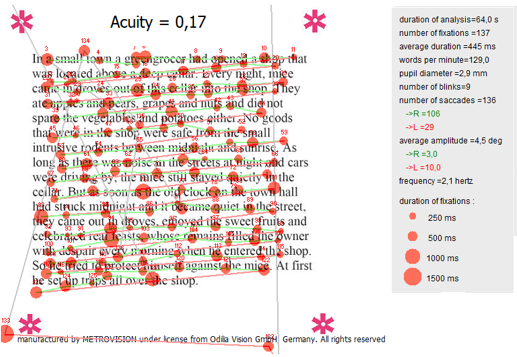
4 letter sizes are available on Metrovision's system, corresponding to visual acuities of 0.08, 0.13, 0.17 and 0.26.
The analysis of the gaze path highlights the fixations (red dots) as well as the saccades (green lines). The software automatically determines the reading speed (in words per minute), the number of fixations as well as the number of saccades and their average amplitude.
Application to the exploration of visual scenes
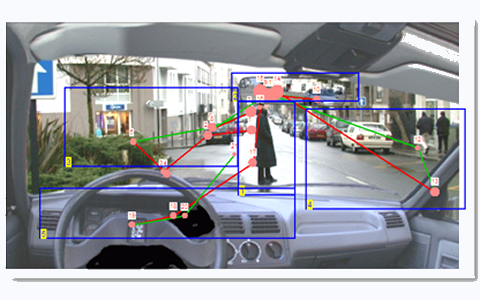
The analysis of eye scan path during the exploration of a visual scene shows the position and duration
of fixations (position and size of the red dots) as well as the sequence of fixations.
In the example of a driving scene, the program indicates which elements of the image have been looked at by
the subject and which were ignored.
.
The visual scene can also be divided into areas of interest. The program indicates the time before the first
access to each zone and the time of fixation within each zone.
References
PDFEye movements and verbal reports in neglect patients during a letter reading task.
PDFRefixation strategies in four patients with macular disorders.
PDFVisual dysfunction in children with reading problems.


