MULTIFOCAL ERG
CLINICAL EXAMPLES
J. Charlier in collaboration
with
Pr Jean-Claude Hache, Dr Sabine Defoort-Dhellemmes, Dr Xavier Zanlonghi,
Mme Danielle Basset
The following examples are provided to illustrate the interpretation of multifocal ERG exams on the Vision Monitor System.
The first step in the interpretation
of results is to assess their quality. Results of poor quality may lead to erroneous
conclusions. Therefore quality should be evaluated before any conclusion is drawn
on alterations of responses.
Results' quality is mainly dependent upon
the the amount of electric noise present in the recorded signals and the accuracy
of the patient's fixation.
These items can be evaluated by the number of indicators.
It is also important to use these indicators during the examination and correct
possible problems before the examination is completed.
The second step in the interpretation is the analysis of responses and the detection of abnormalities. For this purpose, the Vision Monitor program compares the results to a normal data base and points out those parameters which differ significantly from the normal range.
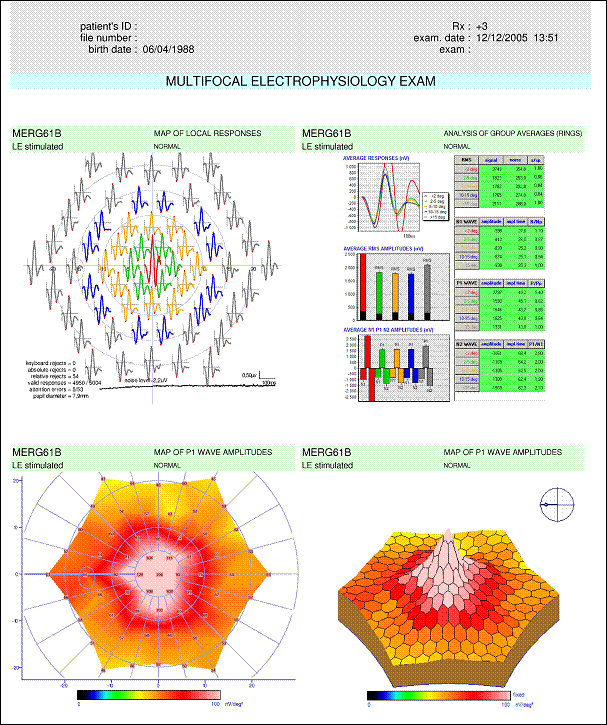
All the following results have been obtained with identical test conditions which correspond to the test conditions of the normal data base :

|
The noise level
of the recorded signal is within normal limits :
|
|
|
Fixation is
of good quality: - the foveolar peak is clearly visible
|
|
|
All indicators are « green » : no abnormality has been detected when comparing the result to the normal data base. Background :
in the ring analysis, the program computes the average response of the 5
following areas: : fovea,
|
|
(result from Lille University Medical Center)
|
The noise level
is within normal limits : |
|
|
The quality of
fixation is good: - the foveolar peak is clearly visible |
|
|
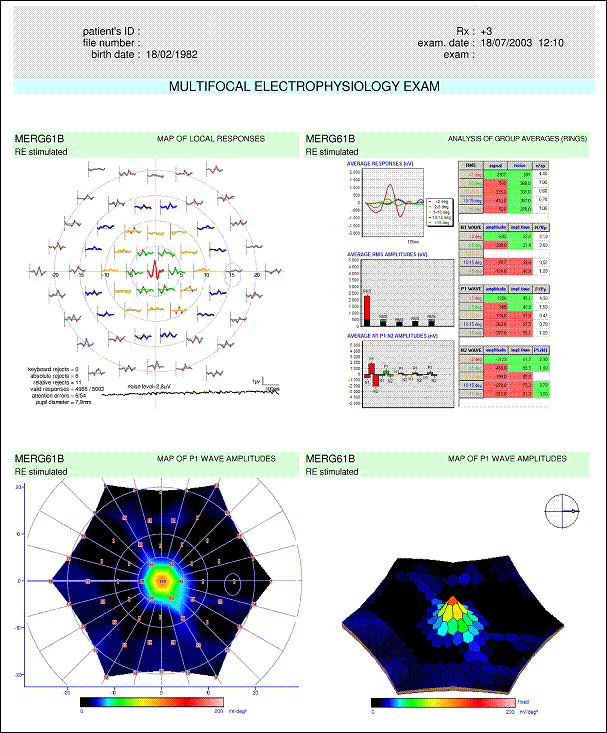
The response from the fovea (<2 degrees) is normal : for this area, indicators are green for the measurements of the signal RMS value, for the amplitudes of N1, P1 and N2 as well as for the implicit times of these peaks. All the amplitudes of peripheral responses are significantly lower than normal (all indicators are red) and, for eccentricities larger than 5 degrees, the implicit times are larger than normal. The ratio of amplitudes P1/ N1 (somehow similar to the B/A ratio used in ganzfeld ERG) remains normal, which characterizes a defect of the photoreceptor layer.
Notes: The amplitude ratios (s/sp, N/Np, P/Pp) have not been interpreted because the measurements from the periphery are lower than normal. |
|
(result from Lille University Medical Center)
|
The noise level
is within normal limits :
. |
|
|
Quality of fixation : |
|
|
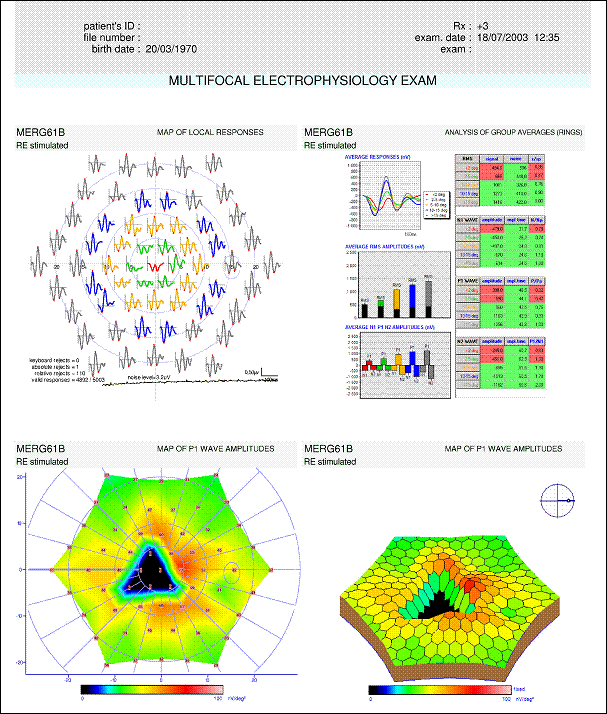
The ring analysis confirms the alteration of central responses : the amplitudes of N1 and P1 are signficantly reduced for the rings with eccentricities lower than 5 degrees.
|
|
(result from Lille University Medical Center)
|
The noise level
is within normal limits :
|
|
|
Fixation is good: - the fovea peak is clearly visible |
|
|
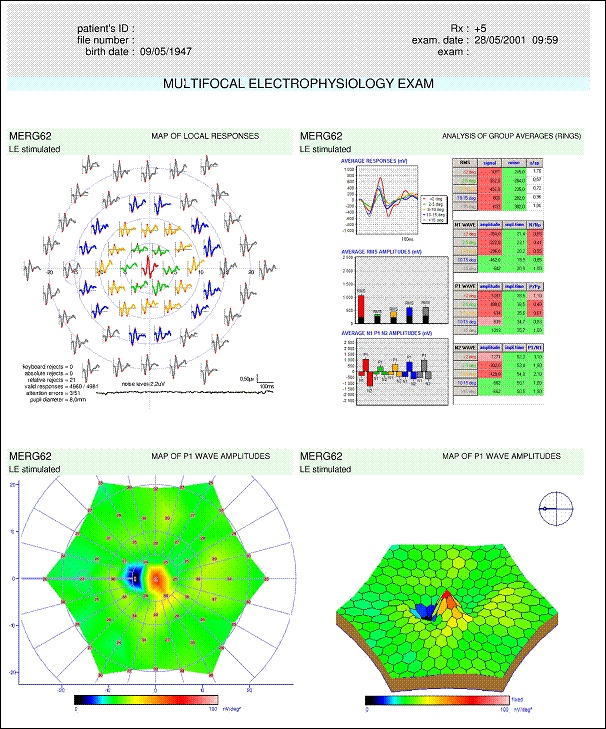
The amplitudes of peaks N1, P1 and N2 are normal in the periphery (over 15 degrees of eccentricity). However, these amplitudes are significantly reduced for the central zones. The histogram of amplitudes shows that these alterations are more extensive for the perifoveolar area (2 – 5 degrees). The P1/N1 ratio is within normal limits which characterizes a defect of the photoreceptor layer. |
|
(result from Lille University Medical Center)
|
The noise level
is within normal limits :
|
|
|
Fixation is good : - the fovea peak is clearly visible |
|
|
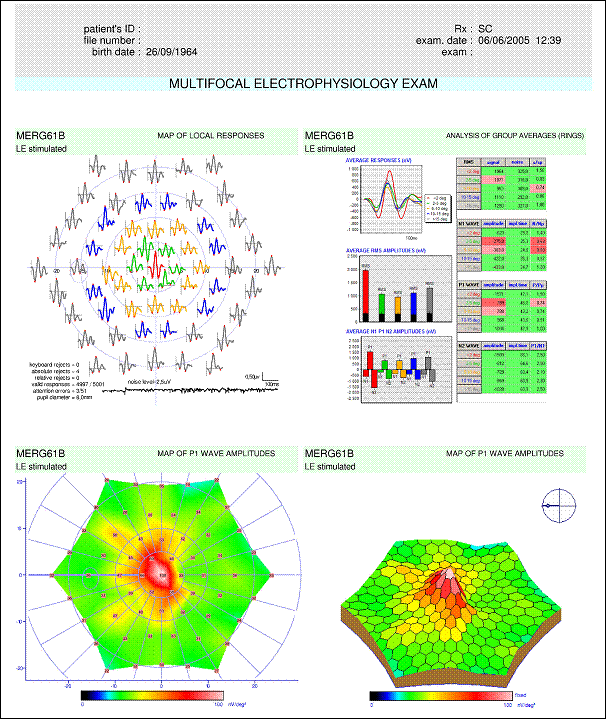
The amplitude of N1 and P1 peaks is reduced for the 2-5 and 5-10 degrees zones.
The periphery over 10 degrees and the fovea are normal.
The P1/N1 ratio is within normal limits indicting an alteration of the photoreceptor layer.
|
|
(result from Lille University Medical Center)
|
The noise level
is within normal limits :
|
|
|
Fixation: - the fovea peak
was not visible because of the alteration of the central field. |
|
|
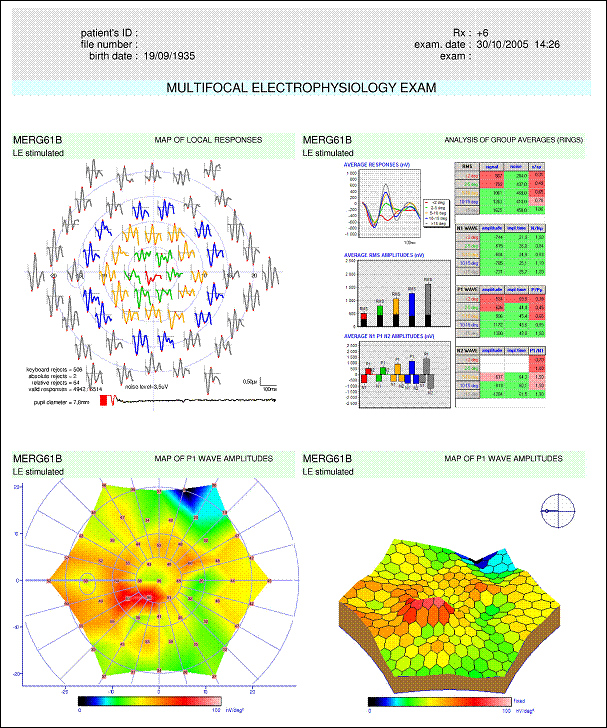
The amplitudes and implicit times of the N1 peaks are within normal limits for all locations.
The responses from the more eccentric zones are normal.
The P1 amplitude is significantly reduced for all central zones.
The P1/N1 ratio shows an alteration of the inner layers of the retina which is more important in the center but spreads out to the periphery as far as 15 degrees of eccentricity. |
|
(result from Dr Zanlonghi, Nantes)
|
The noise level
is within normal limits : |
|
|
Quality of fixation : Le control of attention could not be used on this patient. The fovea peak is not clearly visible. However the stability of the base line indices that fixation was stable.
|
|
|
The ring analysis shows a significative reduction of the P1 amplitude for the fovea and perifovea areas. The reduced value of the P1/N1 ratio is characteristic of an alteration of inner layers of the retina.
The visual field exam shows deficits that correspond to the result of the multifocal ERG. :
|
|